In November 2025, the global cryptocurrency market stands at $3.47 trillion, with Bitcoin alone worth over $2 trillion. Yet if you asked 100 investors what actually determines the value of a cryptocurrency, you’d likely get 100 different answers.
Unlike stocks backed by company earnings or fiat currency backed by government decree, cryptocurrency value comes from a complex mix of code, economics, and human behavior.
In 2024, Bitcoin’s halving event cut mining rewards in half, yet BTC soared from $60,000 to over $126,000. Meanwhile, thousands of altcoins launch annually, most failing within months, while a select few capture billions in market cap.
Traditional valuation frameworks don’t work for cryptocurrencies. There are no quarterly earnings reports, no physical assets, and no central authority setting prices. Crypto operates 24/7 across global markets, subject to extreme volatility driven by Twitter posts, regulatory announcements, and algorithmic trading.
This creates confusion: Is crypto value purely speculative? Do fundamentals even apply? How can Bitcoin be worth $105,000 when it lacks intrinsic value? The 2022 crypto winter destroyed $2 trillion in market cap, exposing that not all digital assets are created equal.
This guide breaks down cryptocurrency valuation from first principles, explaining why Bitcoin commands a $2T market cap while thousands of tokens trade under $1M. We’ll cover economic theory, technical mechanisms, psychological factors, and real-world events with quantitative frameworks and expert analysis.
You’ll learn the 8 fundamental factors determining cryptocurrency value, supply/demand dynamics unique to digital assets, tokenomics principles, network effects, production cost models, regulatory impact, institutional adoption drivers, and practical tools for evaluating any cryptocurrency.
Key Takeaways
- Supply and demand economics drive crypto valuations, with scarcity playing a major role in price determination
- Utility and real-world use cases directly impact value cryptocurrencies with actual applications tend to maintain stronger valuations over time
- Network effects create exponential value growth as more users join a cryptocurrency ecosystem
- Market sentiment and speculation cause dramatic short-term price volatility, often disconnected from fundamental value
- Regulatory developments across different jurisdictions significantly influence investor confidence and market accessibility
- Competition and market positioning affect individual cryptocurrency values as projects compete for dominance
- Security levels and decentralization impact trust and therefore value, with more secure networks typically commanding higher valuations
What is Cryptocurrency Value? Definition & Context
The value of a cryptocurrency is determined by the intersection of supply and demand, influenced by eight key factors: (1) scarcity through fixed supply caps, (2) utility for real-world applications, (3) network effects from growing adoption, (4) production costs like Bitcoin mining expenses, (5) regulatory environment and legal clarity, (6) market sentiment and speculation, (7) technological superiority and security, and (8) tokenomics including distribution and incentives.
Unlike fiat currencies backed by governments, crypto derives value from code, community consensus, and proven use cases. Supply constraints combined with increasing demand drive long-term appreciation, while short-term prices reflect market psychology and external events.
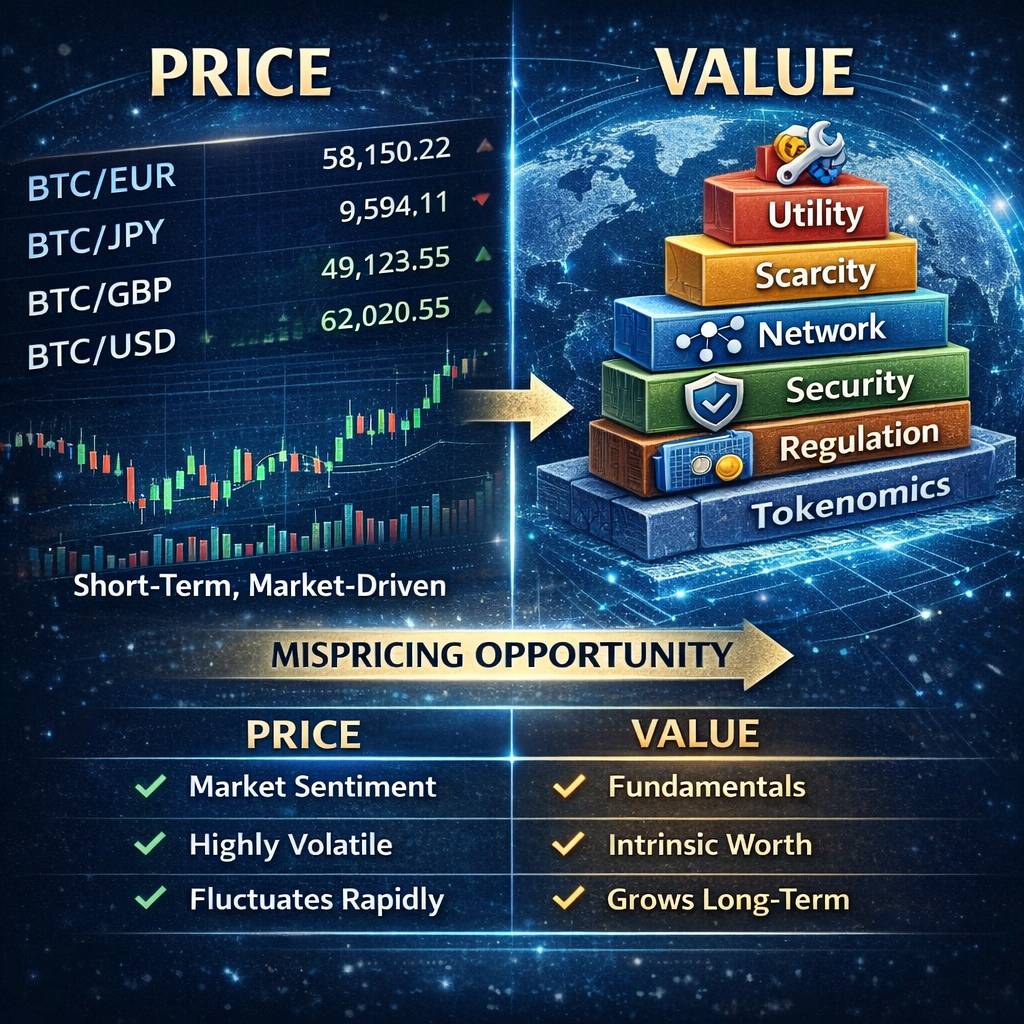
Value vs. Price: Understanding the Difference
Price is what markets currently pay for a cryptocurrency on exchanges, determined second-by-second by supply and demand. Value is the fundamental worth based on utility, scarcity, network strength, and long-term viability.
The gap between price and value can be significant due to speculation, creating investment opportunities.
For example, Bitcoin’s price dropped to $16,000 in November 2022, but fundamental value 21M cap, $10B+ institutional holdings, growing adoption remained intact, enabling recovery to $105K+.
How Crypto Differs from Traditional Assets
- Valuation Basis: Traditional assets rely on earnings, cash flow, and physical assets. Cryptocurrencies depend on supply limits, utility, and network size.
- Backing: Fiat currency has government backing. Gold has physical properties. Crypto has code, cryptography, and consensus.
- Transparency: Traditional companies provide quarterly reports and audited financials. Crypto offers 24/7 on-chain data and open-source code.
- Market Hours: Stock markets operate 9:30am-4pm on weekdays. Crypto trades 24/7/365 across global markets.
- Price Discovery: Traditional assets trade on regulated exchanges during set hours. Crypto trades on multiple exchanges and decentralized platforms simultaneously.
- Intrinsic Value: Stocks have discounted future cash flows. Crypto has network effects, utility, and scarcity.
Why crypto valuation is unique: Cryptocurrencies don’t generate profits (except staking yields), requiring different frameworks. Value grows non-linearly with adoption.
Fixed supply caps create predictable scarcity unlike fiat currencies. Value emerges from worldwide agreement, not central authority decree. All code is public anyone can verify supply, distribution, and functionality.
Market Cap as the Primary Metric
Market capitalization equals current price multiplied by circulating supply. This shows total value, not just per-unit price, avoiding “unit bias.”
Categories: Large-cap (>$10B), Mid-cap ($1B-$10B), Small-cap (<$1B).
Example: Bitcoin at $105K with 19.5M circulating supply equals $2.05T market cap.
Limitation: Market cap doesn’t account for locked tokens, lost wallets, or actual liquidity.
Factor #1: Supply & Scarcity – The Foundation of Crypto Value
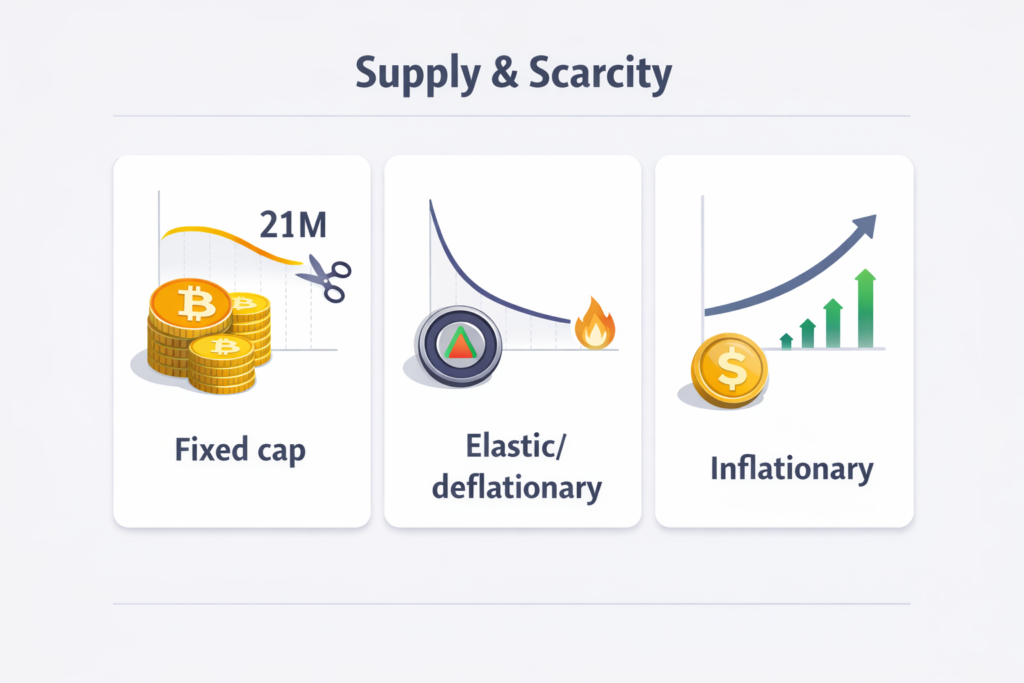
Supply and scarcity explain why some crypto assets hold value while others fade out when there is nothing stopping endless creation.
The Supply Side Economics
Fixed Supply Model (Bitcoin Example)
Bitcoin has a hard cap of 21 million BTC encoded in the protocol. Current circulating supply sits at approximately 19.5 million (92.9% already mined). The final Bitcoin is projected to be mined around year 2140.
This deflationary nature means that as demand grows with fixed supply, price must rise. Bitcoin’s stock-to-flow ratio post-2024 halving makes it scarcer than gold. An estimated 3-4 million BTC are permanently lost (forgotten keys, dead wallets), increasing effective scarcity.
Dynamic Supply Models
Ethereum has no fixed cap. Current supply stands at approximately 120M ETH. However, EIP-1559, introduced in August 2021, brought a burning mechanism where base transaction fees are destroyed, removed from circulation permanently.
Over 4 million ETH has been burned since EIP-1559, making ETH potentially deflationary during high network usage.
The issuance schedule provides approximately 1,800 ETH daily to validators, down from 13,000+ before the Merge.
Inflationary Models
Dogecoin has no supply cap. Five billion DOGE are minted annually, creating an annual inflation rate of approximately 3.3%, which decreases over time as a percentage of total supply.
The community argues that predictable inflation enables use as currency rather than encouraging hoarding of scarce assets. However, this requires continuous demand growth to maintain price.
The Bitcoin Halving Effect
Every 210,000 blocks (approximately 4 years), Bitcoin mining rewards are cut in half:
- 2009-2012: 50 BTC per block
- 2012-2016: 25 BTC per block
- 2016-2020: 12.5 BTC per block
- 2020-2024: 6.25 BTC per block
- April 19, 2024: 3.125 BTC per block (current)
Supply Reduction Impact
Daily new supply dropped from approximately 900 BTC/day to approximately 450 BTC/day. Annual inflation fell from approximately 1.8% to approximately 0.9% (lower than gold’s approximately 1.5%). This represents a 50% reduction in new Bitcoin entering the market.
2024 Halving Case Study
Pre-halving price ranged from $60,000-$70,000 (January-April 2024). The post-halving rally reached $73,000 within weeks, eventually surpassing $126,000 by late 2024/early 2025.
Mining economics shifted dramatically. Production costs doubled from approximately $20,000-$25,000 to $40,000-$45,000 per BTC. Smaller, inefficient miners shut down, causing hash rate to dip 3-7% temporarily.
Hash rate recovered within 2-3 months as prices rose and difficulty adjusted. Institutional timing was significant; spot ETF approvals in January 2024 coincided with the halving, amplifying the demand shock against supply reduction.
Historical Halving Patterns
- 2012 Halving: BTC $12 to $1,100+ within 12 months (9,000%+ gain)
- 2016 Halving: BTC $650 to $20,000 within 18 months (3,000%+ gain)
- 2020 Halving: BTC $8,700 to $69,000 within 18 months (700%+ gain)
Percentage gains decrease each cycle as the market matures. Peak typically occurs 12-18 months post-halving.
Token Burns & Supply Destruction
Burn mechanisms permanently remove tokens from circulation to increase scarcity without reducing utility, return value to token holders through deflation, and signal long-term commitment from project teams.
Major Burn Programs
Binance Coin (BNB) conducts quarterly burns based on trading volume, committed to burning 50% of total supply. 100M BNB of 200M total have already been burned.
Ethereum implements dynamic burns via EIP-1559. Over 4M+ ETH has been burned since August 2021.
Shiba Inu (SHIB) relies on community-driven burns of trillions of tokens.
Terra (LUNA) serves as a cautionary tale. Aggressive burning tied to UST demand collapsed when demand reversed.
Burn Impact on Value
Supply reduction follows basic supply/demand principles; fewer tokens available increases value per token. Burns demonstrate team confidence and commitment.
However, projects must balance burns with emission to maintain healthy supply dynamics. On-chain verification allows the community to confirm burns actually happened.
Factor #2: Demand Drivers – What Makes People Want Crypto
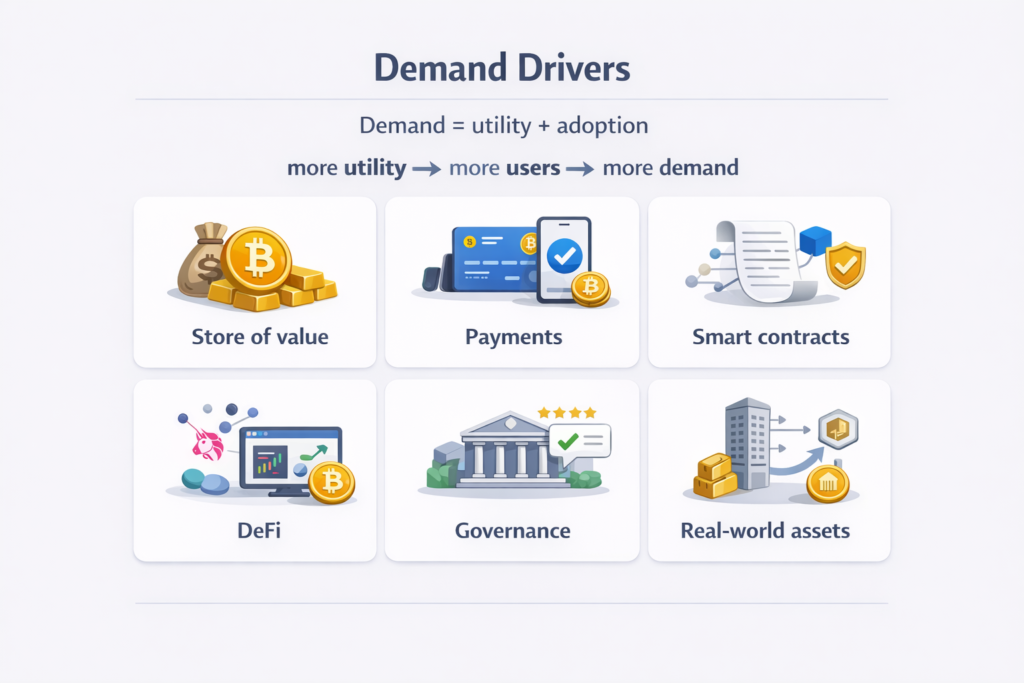
Demand is about the real reasons people choose to buy, hold, or use a crypto instead of ignoring it.
Utility & Use Cases
Real-world applications drive demand for cryptocurrencies. Here are the primary use cases:
Store of Value (Digital Gold)
Bitcoin serves as “digital gold” for wealth preservation. Its properties include scarcity (21M cap), divisibility, portability, and censorship-resistance.
The use case focuses on inflation hedging in countries with unstable fiat currencies like Venezuela, Turkey, and Argentina. Countries like El Salvador adopted BTC as legal tender in 2021.
Medium of Exchange (Payments)
Stablecoins dominate with $246.58B market presence. USDT and USDC enable fast, cheap global transfers. Lightning Network enables instant, low-cost Bitcoin payments.
Growing merchant adoption occurs at retailers and online services. Remittances are cheaper and faster than Western Union for international transfers.
cSmart Contract Platforms
Ethereum powers a $150B+ DeFi ecosystem, NFT marketplaces, and decentralized applications. Users must hold ETH to pay gas fees for transactions. Over 200,000 developers build on Ethereum.
Solana offers 65,000 TPS capacity, attracting developers. 17% of buyers plan to purchase SOL in 2025.
Decentralized Finance (DeFi)
Aave and Compound enable loans without banks. Yield farming offers 3-20%+ APY on crypto deposits. Decentralized exchanges like Uniswap and SushiSwap enable trustless trading. Liquidity providers earn fees by providing trading liquidity.
Governance Rights
Token holders vote on protocol changes through DAO participation. They govern multi-billion dollar treasuries Uniswap controls $4.2B, Arbitrum controls $3.8B. Governance tokens carry a premium for influence rights.
Tokenization of Assets
Real-world assets (RWAs) including real estate, bonds, and commodities are moving on-chain. For example, Arbitrum DAO invested $15.5M in tokenized RWAs in March 2025. RWA tokenization is expected to reach $16 trillion by 2030 according to BCG estimates.
Network Effects & Adoption Curves
Network effects explain why a crypto becomes more valuable as more people start using it.
Metcalfe’s Law Application
The formula states that network value is proportional to the square of users (V ∝ n²). The principle: each additional user makes the network exponentially more valuable.
Example: A social network with 100 users has 4,950 possible connections. With 1,000 users, it has 499,500 connections.
Crypto application: More wallets, merchants, and developers mean higher utility, which means higher value.
Network Effect Types in Crypto
- Security Effect: Larger networks are more difficult to attack (Bitcoin’s hash rate).
- Payment Network Effect: More merchants accept means more consumers use.
- Developer Effect: More developers build means better apps, which attracts more users.
- Liquidity Effect: Higher volume means tighter spreads and better trading experience.
- Integration Effect: Third parties integrate with widely-adopted platforms.
- Single-Currency Preference: Users prefer the same currency to avoid exchange fees.
Adoption Metrics Driving Value
Active addresses: Bitcoin sees 1M+ daily active addresses. Ethereum sees 500K+.
Transaction volume: $252.35B daily crypto volume (November 2025).
Developer activity tracked through GitHub commits, new projects, and active developers. Ethereum recorded 39M+ transactions in December 2024, showing sustained usage.
Network Value to Transactions (NVT) Ratio equals market cap divided by daily transaction volume. High NVT (network overvalued relative to usage) signals a bubble.
Low NVT (network undervalued relative to usage) signals a buying opportunity. Bitcoin NVT historically ranges 40-60. Spikes above 100 signal overvaluation.
Critical Mass & Tipping Points
Michael Saylor’s $100B threshold: Networks reaching $100B market cap achieve near-certain dominance. Bitcoin crossed this threshold in 2017 and now stands at $2T+ market cap.
Ethereum crossed $100B in 2021 and sustained dominance in smart contracts. Once dominant, a 10x improvement is needed for competitors to disrupt.
Institutional Adoption Impact
When institutions get involved, it changes how people view crypto and how much trust it gets.
Spot ETF Approvals – Game Changer
January 2024 saw 11 Bitcoin spot ETFs approved, including BlackRock, Fidelity, and Grayscale. Capital inflows reached $25B+ net within 10 months. The market impact provided a regulated vehicle for institutional and retail access.
May 2024 brought 8 Ethereum spot ETF approvals. The future pipeline includes XRP, Solana, Dogecoin, and Litecoin ETFs under SEC review.
Corporate Treasury Adoption
MicroStrategy (MSTR) holds 150K+ BTC (approximately $15.75B) on its balance sheet. Tesla holds approximately 9,720 BTC.
Digital Asset Treasury companies control approximately 4% of circulating BTC and ETH. More corporations are diversifying treasuries with crypto, removing supply from the market and increasing scarcity.
Institutional Players
BlackRock, the world’s largest asset manager with $10T AUM, now offers Bitcoin. Fidelity, a major financial institution, supports crypto custody and trading.
Grayscale pioneered institutional crypto investment products. The impact includes legitimacy, regulatory pressure for clarity, and access to massive capital pools.
Factor #3: Production Costs & Mining Economics
Production costs explain what it actually takes to create new coins and why that process matters for price.
Bitcoin Mining Cost Floor
The mining cost floor explains the lowest price level where Bitcoin can be produced without miners losing money.
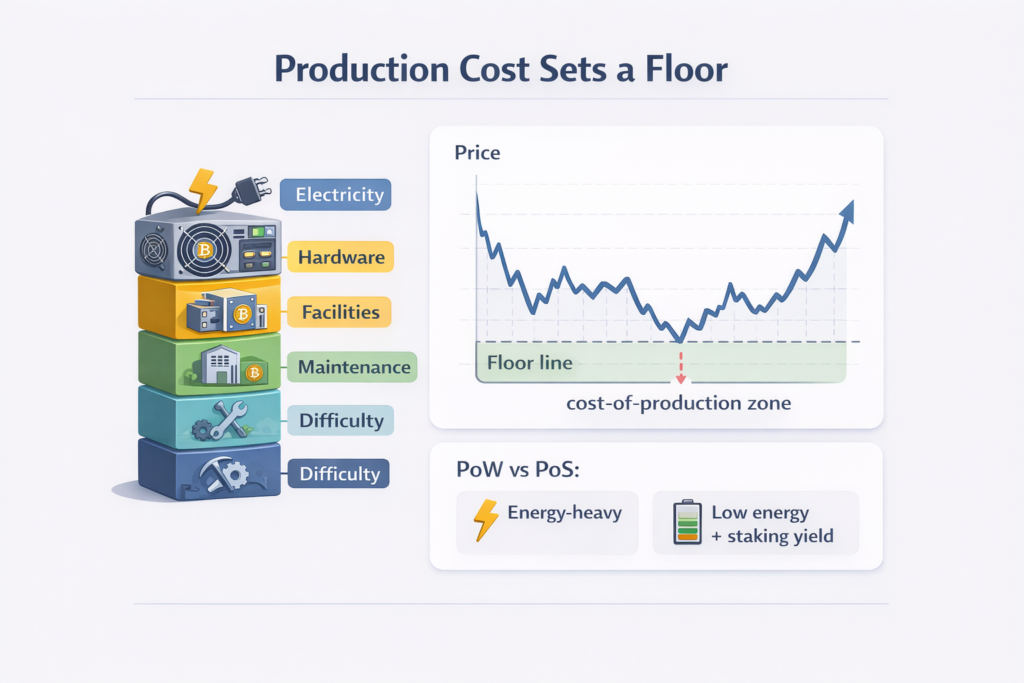
The Cost-of-Production Theory
In competitive markets, prices tend toward production costs. For crypto, mining costs provide a “floor” below which price rarely stays long-term. Bitcoin’s Proof-of-Work requires substantial computational power and electricity.
Mining Cost Components
- Electricity (75-85% of costs): The largest expense. Average $0.04-$0.06/kWh for competitive miners.
- Hardware (ASIC miners): $2,000-$15,000 per unit. Depreciate over 2-3 years.
- Cooling/Facilities: Data center costs and cooling systems.
- Maintenance: Repairs, replacements, and technical staff.
- Difficulty Adjustments: The network auto-adjusts every 2,016 blocks (approximately 2 weeks) to maintain 10-minute block time.
2024 Halving Impact on Mining Economics
- Pre-halving production cost: $20,000-$25,000 per BTC (6.25 BTC rewards).
- Post-halving production cost: $40,000-$45,000 per BTC (3.125 BTC rewards).
- Price required: Miners need BTC above $45K to remain profitable.
- Actual price: Bitcoin reached $126,000 (late 2024), validating cost floor theory.
- Miner consolidation: Smaller, inefficient operations shut down.
- Hash rate impact: Dipped 3-7% initially as unprofitable miners exited.
- Recovery: Difficulty adjustment plus price appreciation brought miners back online.
Geographic Mining Distribution
- United States: 38% of global hash rate (largest). Cheap energy in Texas and Kentucky.
- China: Previously dominant. 2021 ban dispersed miners globally.
- Kazakhstan: 18% hash rate. Cheap energy.
- Russia and Canada: Combined approximately 15%. Cold climate plus cheap hydro/nuclear power.
Mining Profitability Metrics
Hash Price
Hash price represents revenue per terahash per day. Calculation: Block reward plus transaction fees divided by network hash rate. Current: approximately $50-$80 per PH/day (fluctuates with Bitcoin price and difficulty). Break-even varies by miner efficiency and electricity cost.
Puell Multiple
Formula: Daily issuance value (USD) divided by 365-day moving average of daily issuance value.
Interpretation: Above 4 means miners are extremely profitable (potential sell pressure). Below 0.5 means miners are capitulating (potential bottom). Use: Identifies market cycle phases based on miner profitability.
Miner Revenue Streams
- Block subsidy: Currently 3.125 BTC per block (approximately $328,125 at $105K).
- Transaction fees: Variable, spike during congestion.
- Ordinals/BRC-20: New Bitcoin use cases are increasing fee revenue.
- Transition: Bitcoin is designed to shift from subsidy to fee-based security model over time.
Proof-of-Stake Economics
Ethereum Post-Merge (September 2022)
- Staking requirement: 32 ETH (approximately $105K) to run a validator.
- Staking yield: 3-5% APR in ETH.
- Production cost: Hardware (approximately $1,000) plus electricity (99% less than PoW) plus 32 ETH opportunity cost.
- Validator count: 900,000+ validators securing the network.
- Economics: Lower barriers than mining. Passive income model.
Staking Impact on Supply
- Locked supply: Approximately 27M ETH staked (22% of circulating supply).
- Reduced sell pressure: Stakers hold long-term for yield.
- Value support: Staking rewards reduce selling and increase scarcity.
Factor #4: Tokenomics – The Economic Design
Tokenomics explains how a crypto is set up to work over time, not just how it looks on day one.
What is Tokenomics?
Tokenomics combines “token” and “economics” to describe a cryptocurrency’s economic model, including supply, distribution, utility, and incentive structures.
Core Components
Tokenomics starts with total supply, which sets the hard limit on how many tokens can ever exist. From there, circulating supply shows how much of that total is already in the market and actually able to move price.
How those tokens first entered circulation comes down to allocation, whether they went to the team, early investors, or the wider community, and vesting determines when those groups are allowed to sell instead of dumping all at once.
As the project grows, the emission schedule controls how new tokens are released over time, shaping long term inflation and sell pressure. All of this only matters if the token has real utility, meaning it plays a clear role inside the ecosystem.
To balance supply, some projects introduce burns that permanently remove tokens, while staking and governance give holders a reason to lock tokens up and stay involved rather than exit.
Why Tokenomics Matters
- Investment due diligence: Good tokenomics equals sustainable project. Bad tokenomics equals likely failure.
- Price impact: Massive unlocks can tank prices 30-80%.
- Long-term viability: Well-designed incentives align stakeholders.
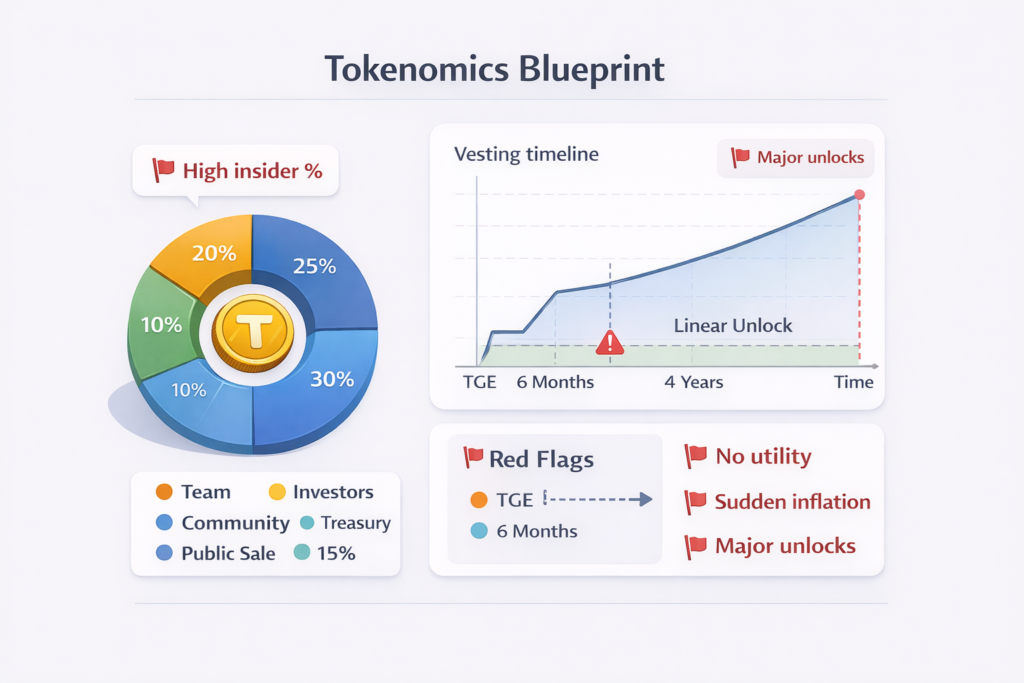
- Red flags: Team holding over 40%, no utility, sudden inflation changes.
Token Distribution & Vesting
Typical Allocation Structure
- Team/Founders: 15-25% (2-4 year vesting).
- Private/Seed Investors: 10-20% (1-3 year vesting).
- Community/Airdrop: 10-30% (immediate or cliff vesting).
- Treasury/Ecosystem: 30-50% (controlled release for development).
- Public Sale: 5-15% (immediate liquidity).
Vesting Mechanisms
- Cliff: No tokens available until a specific date (for example, 1-year cliff).
- Linear vesting: Gradual release over time (for example, monthly over 4 years).
- Purpose: Prevents early dumps and aligns long-term incentives.
- Transparency: Check vesting schedules on project websites and Token Terminal.
Distribution Concerns
Whale concentration: If the top 10 holders control over 50%, there’s risk of manipulation. For example, Uniswap’s top 10 addresses hold 42% of UNI supply, which is concerning but mitigated by delegation.
VC heavy: Large VC allocations create future sell pressure as vesting unlocks.
Fair launch: Projects like Yearn (YFI) distributed 100% to the community with no team pre-mine.
Unlock Events & Price Impact
Major unlocks occur when large vesting periods end and tokens flood the market. Price drops of 20-50% are common on major unlock days. For example, Aptos (APT) cliff unlock in October 2023 led to a 30% price decline. Use Token Unlocks calendar to anticipate events.
Token Utility & Value Capture
Utility Categories
Transaction Fees (Gas): ETH is required to use Ethereum. SOL is needed for Solana. Value capture occurs through usage creating demand for the token. Burn mechanics like EIP-1559 burn ETH, reducing supply with each transaction.
Governance Rights: UNI holders vote on Uniswap protocol changes. UNI governance controls a $4.2B+ treasury. Governance power has economic value.
Staking Rewards: Stake ETH to earn 3-5% APR. The mechanism locks supply, earns yield, and secures the network. Staking demand increases token price.
Revenue Sharing: MakerDAO (MKR) holders can vote to enable fee distribution. Direct value goes to token holders who receive cash flows. This is rare most crypto tokens don’t distribute revenue due to regulatory concerns.
Access/Discounts: BNB provides a 25% trading fee discount on Binance. Utility demand comes from traders buying BNB for savings. Continuous demand comes from exchange users.
Value Accrual Mechanisms
Buyback and burn: Protocol uses revenue to buy tokens and burn them (Binance quarterly burns).
Staking yield: Rewards incentivize long-term holding.
Deflation: Burns reduce supply, increasing value per token.
Network effects: More utility equals more users, which equals higher value.
Red Flags in Tokenomics
- No clear utility: Token not required for anything.
- Excessive inflation: High emission dilutes holders.
- Unfair distribution: Team/insiders hold over 50%.
- No vesting: Team can dump immediately.
- Unlimited supply: No scarcity mechanism.
- Ponzi mechanics: Relies on new money to reward old holders (see Terra/Luna).
Terra/Luna Collapse – Tokenomics Cautionary Tale
Flawed Design
Mechanism: LUNA supply expanded or contracted to maintain UST $1 peg.
Death spiral: When UST lost its peg, LUNA hyperinflated to restore it.
May 2022: UST de-pegged and LUNA supply exploded from 350M to 6.5 trillion.
Value destruction: LUNA went from $120 to $0.0001 in days.
Impact: $45B+ in value evaporated. Crypto market crashed.
Lessons
Algorithmic stablecoins: Reflexive systems can collapse rapidly.
Unsustainable yields: 20% APY on UST (Anchor Protocol) was too good to be true.
Tokenomics matter: Poorly designed incentives lead to catastrophic failure.
Due diligence: Understanding token mechanics prevents losses.
Factor #5: Regulatory Environment & Legal Clarity

Regulation determines how safe people feel buying, holding, and using crypto in the real world.
Impact of Regulation on Crypto Value
Regulation affects crypto value because rules can either make people feel safe enough to participate or push them away.
Regulatory Clarity Equals Higher Valuations
Institutional access: Clear rules enable banks and funds to participate.
Risk reduction: Legal certainty reduces regulatory risk premium.
Example: Spot ETF approvals (January 2024) led to Bitcoin gaining 150% within 10 months.
Contrast: SEC lawsuits against Ripple suppressed XRP price from 2020-2023.
Negative Regulatory Events
China mining ban (2021): Bitcoin hashrate dropped 50%. Price declined 50%.
SEC enforcement actions: Lawsuits against Coinbase and Binance created uncertainty.
Howey Test uncertainty: Which tokens are securities versus commodities remained unclear until 2025.
2025 Regulatory Revolution
In 2025, crypto rules stopped being vague and started directly shaping how projects operate and grow.
GENIUS Act (July 18, 2025)
- Purpose: Federal framework for stablecoins.
- Requirements: 100% reserve backing, monthly disclosures, annual audits.
- Impact: Legitimizes $246B stablecoin market. Enables ACH/FedNow integration.
- Winners: USDC and USDT are compliant. Algorithmic stablecoins (DAI) face challenges.
- Market reaction: Stablecoins gained legitimacy. Bitcoin gained 12% on passage.
SEC Leadership Change – Paul Atkins Era
Gary Gensler led an enforcement-heavy approach (2021-January 2025).
Paul Atkins is pro-innovation, a former SEC Commissioner, and crypto advocate.
Crypto Task Force formed in February 2025 under Commissioner Hester Peirce.
Goals: Clear registration pathways, innovation exemptions, collaboration with CFTC.
Actions: Dismissed Coinbase lawsuit (February 2025), stayed Binance case.
Impact: Bitcoin gained 18%. Altcoins gained 35% on average since Task Force announcement.
Trump Crypto Executive Order (January 23, 2025)
Declaration: Crypto designated as national priority.
Working Group: 6-month deadline for legislative recommendations.
Digital Asset Reserve: Proposal to create national crypto stockpile from seized assets.
Message: U.S. aims to be “crypto capital of the world.”
Market impact: Crypto market cap increased by $400B within 3 weeks.
CLARITY Act Progress
- Purpose: Define Bitcoin and Ethereum as commodities under CFTC (not securities).
- Status: Pending Congressional approval.
- Impact: If passed, removes SEC jurisdiction over decentralized tokens.
- Winners: Bitcoin and Ethereum gain regulatory certainty.
Global Regulatory Comparison
- United States: Shifting from hostile to supportive (2025). Major positive catalyst.
- European Union: MiCA comprehensive framework (December 2024). Clarity attracts institutional capital.
- Singapore: Progressive, clear guidelines. Crypto hub attracts projects.
- China: Outright ban on trading and mining. Negative projects avoid.
- El Salvador: Bitcoin legal tender (2021). Symbolic positive.
- Japan: Licensed exchanges, clear regulations. Positive with growing adoption.
Tax Treatment Impact on Value
Taxes affect how people buy, sell, and hold crypto, which directly influences how valuable it feels to own.
U.S. Tax Landscape
- Capital gains: Crypto is taxed as property. Up to 39.6% on short-term gains.
- Complexity: Every transaction is a taxable event. DeFi, staking, and airdrops complicate matters.
- Compliance: 52% of investors report difficulty with crypto taxes.
- Burden: High taxes reduce net returns and dampen retail enthusiasm.
Global Tax Approaches
- Germany: 0% tax on crypto held over 1 year (favorable for holders).
- Portugal: Crypto gains were tax-free until 2023. Now taxed but still favorable.
- Singapore: No capital gains tax on crypto (major attraction).
- U.K.: Up to 20% capital gains tax.
- Impact: Tax-friendly jurisdictions attract traders. High-tax countries see capital flight.
Factor #6: Market Sentiment & Psychology
Market sentiment is about how people feel and think about crypto at a given moment, not just what the numbers say.
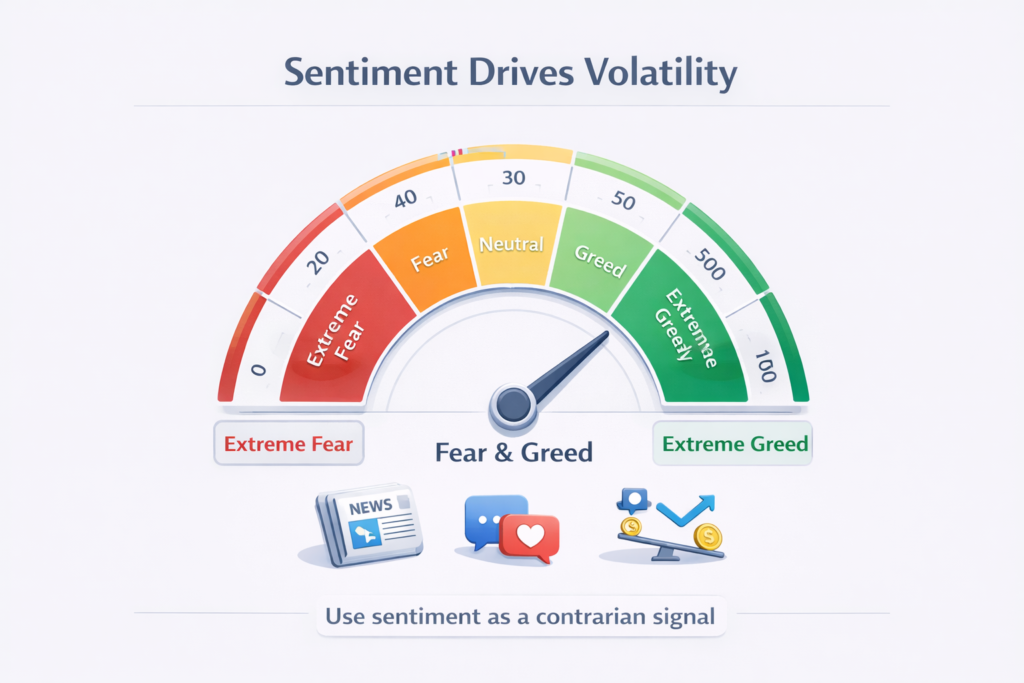
The Fear & Greed Index
The Crypto Fear & Greed Index (Alternative.me) quantifies market emotions on a 0-100 scale:
- 0-24: Extreme Fear (capitulation, oversold)
- 25-44: Fear (caution, bearish sentiment)
- 45-55: Neutral (balanced sentiment)
- 56-75: Greed (bullish, buying pressure)
- 76-100: Extreme Greed (euphoria, overbought)
Index Components
- Volatility (25%): High volatility equals fear.
- Market Momentum/Volume (25%): Strong volume plus momentum equals greed.
- Social Media (15%): Twitter and Reddit sentiment analysis.
- Surveys (15%): Weekly crypto polls.
- Dominance (10%): Bitcoin dominance (rising equals fear in altcoins).
- Trends (10%): Google Trends search volume.
Using Fear & Greed as Contrarian Indicator
- Extreme Fear (below 20): Historically good buying opportunities. For example, COVID crash (March 2020) saw index at 10, Bitcoin at $3,800, followed by rally to $69K.
- Extreme Greed (above 80): Warning of potential correction. For example, November 2021 saw index at 84, Bitcoin at $69K peak, followed by crash to $16K (2022).
Investment Strategy
- Buy fear: When index is below 30, accumulate quality assets.
- Sell greed: When index is above 80, take profits or reduce exposure.
- Current (November 2025): Index at approximately 63 (Greed) suggests caution but not euphoria.
News & Media Impact
Good or bad coverage can shift demand even when nothing else has changed.
Positive News Catalysts
- Institutional adoption: BlackRock and Fidelity announcements drive 5-15% pumps.
- Regulatory wins: ETF approvals and favorable legislation lead to 10-30% rallies.
- Technical upgrades: Ethereum Merge (2022) saw ETH gain 30% in anticipation.
- Corporate treasury adds: MicroStrategy Bitcoin purchases lead to 3-8% Bitcoin spikes.
- Partnership announcements: Major company integrations boost token prices.
Negative News Catalysts
- Exchange hacks: Mt. Gox (2014) and Bitfinex (2016) led to 20-40% crashes.
- Regulatory crackdowns: SEC lawsuits lead to 15-30% declines.
- Fraud exposure: FTX collapse (November 2022) led to 70% market decline.
- Economic data: Fed rate hikes and inflation reports create 10-20% volatility.
- Geopolitical events: War and sanctions trigger flight to safety or risk-off selling.
Social Media Sentiment
- X/Twitter: Elon Musk tweets historically moved Dogecoin 20-50%.
- Reddit: WallStreetBets coordination can drive short-term pumps.
- Discord/Telegram: Community sentiment affects altcoins significantly.
- Influencer impact: Prominent crypto influencers can move small-cap prices 30-100%.
Read Also: From Boom to Bust: Can a Crypto Lose All Its Value?
Bull vs. Bear Market Psychology
Bull and bear markets are less about charts and more about how people think and act at scale.
Bull Market Characteristics
- Greed dominates: FOMO (fear of missing out) drives buying.
- Rising prices: Sustained uptrends with higher highs and higher lows.
- Mainstream attention: Media coverage and celebrity endorsements.
- New project launches: ICOs and IDOs raise billions.
- Example: 2021 bull market saw Bitcoin go from $10K to $69K.
Bear Market Characteristics
- Fear dominates: FUD (fear, uncertainty, doubt) drives selling.
- Falling prices: Sustained downtrends with lower highs and lower lows.
- Media silence: Crypto declared “dead” for the 100th time.
- Project failures: Scams exposed and projects abandoned.
- Example: 2022 “crypto winter” saw Bitcoin drop from $69K to $16K.
Market Cycles Pattern
- Accumulation: Smart money buys while public is uninterested.
- Mark-up: Prices rise and early adopters profit.
- Distribution: Smart money sells to retail FOMO buyers.
- Mark-down: Crash occurs and retail panic-sells at the bottom.
Psychological Biases
- Confirmation bias: Seeking information confirming existing beliefs.
- Herd mentality: Following the crowd into bubbles and crashes.
- Recency bias: Overweighting recent events (crashes make people risk-averse).
- Loss aversion: Holding losers too long and selling winners too early.
Factor #7: Technology, Security & Competition
Technology and security decide whether a crypto actually works as promised or breaks when people start using it.
Technological Superiority
Technological superiority means a crypto does the job better than the alternatives people can easily switch to.
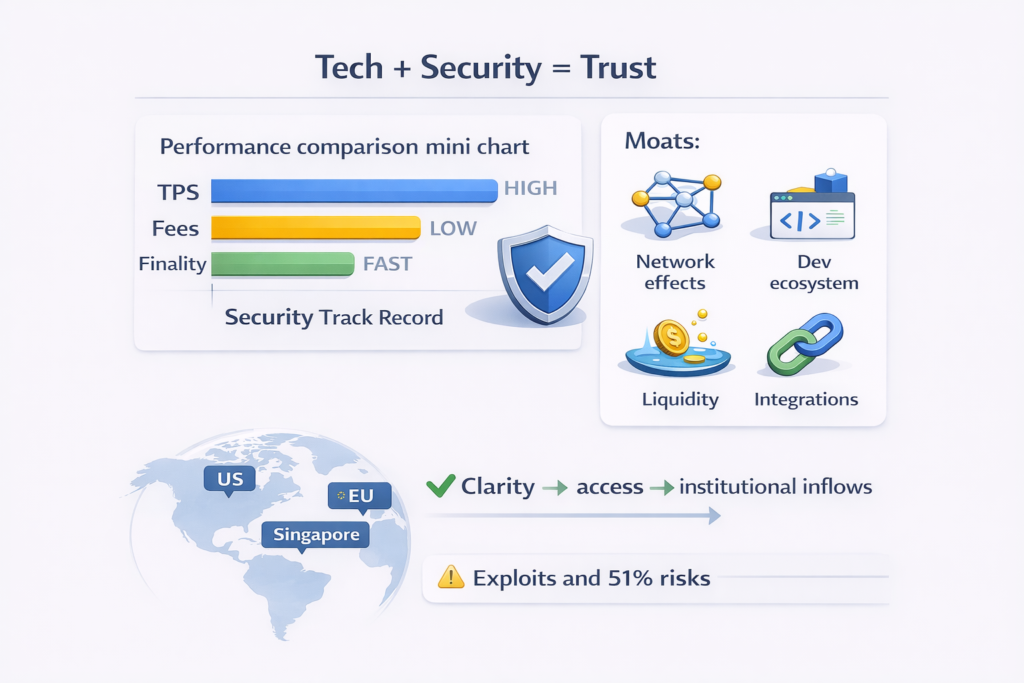
Blockchain Performance Metrics
Transaction speed:
- Bitcoin: 7 TPS
- Ethereum: 15-30 TPS (Layer 1), 1,000+ TPS (Layer 2s)
- Solana: 65,000 TPS capacity
Transaction costs:
- Bitcoin: $1-$5 per transaction
- Ethereum Layer 1: $2-$50 (varies with congestion)
- Ethereum Layer 2s (Arbitrum, Optimism): $0.01-$0.50
- Solana: $0.00025 per transaction
Finality (time until transaction irreversible):
- Bitcoin: Approximately 60 minutes (6 confirmations)
- Ethereum: Approximately 15 minutes
- Solana: Less than 1 second
Innovation & Upgrades
- Ethereum Merge (September 2022): Shifted from Proof-of-Work to Proof-of-Stake. Energy consumption cut 99.95%. Enabled staking and reduced issuance. Made ETH potentially deflationary.
- Bitcoin Taproot (November 2021): Enhanced privacy and smart contract capabilities.
- Solana continuous optimization: Firedancer client (2025) is doubling capacity.
Security Track Record
- Bitcoin: Never successfully attacked (15+ years).
- Ethereum: Secure since DAO hack (2016). Learned lessons.
- Smaller chains: Vulnerable to 51% attacks.
- Smart contract risks: Bugs and exploits (DeFi hacks cost $3B+ in 2022).
Competition & Market Share Battles
Layer 1 Battlefield
Bitcoin: Store of value dominance with 59.91% market dominance.
Ethereum: Smart contract leader with $90B DeFi TVL (60% share).
Solana: High-performance challenger with 53% of revenue-generating activity (shared with Hyperliquid).
BNB Chain: Centralized but offers low fees and strong Binance ecosystem.
Cardano, Avalanche, Polkadot: Strong technology but struggling with adoption.
Layer 2 Scaling
Ethereum Layer 2s: Arbitrum, Optimism, Base, and zkSync dominate.
Transaction cost drop: From $24 (2021) to $0.01 (2025) on Layer 2s.
Layer 2 TVL: $38B+ locked across Ethereum Layer 2s.
Impact: Makes Ethereum competitive with “Ethereum killers.”
Competitive Moats
- Network effects: Bitcoin and Ethereum have critical mass, making them hard to disrupt.
- Developer ecosystem: Ethereum has 200,000+ developers.
- Institutional backing: Bitcoin ETFs and Ethereum ETFs cement status.
- Liquidity: Deep order books and high trading volume.
- Regulatory clarity: Bitcoin and Ethereum recognized as commodities (not securities).
Threats & Disruption Risks
Technological leapfrog: New consensus mechanisms (for example, Proof-of-Stake variants).
Quantum computing: Could break current cryptography (distant threat, solutions in development).
Regulatory ban: Extreme scenario. Unlikely but possible.
Better alternative: If a protocol 10x better emerges, it could disrupt.
Factor #8: Liquidity & Exchange Dynamics

Liquidity affects how easy it is to buy or sell a crypto without moving the price too much.
Liquidity Impact on Valuation
A crypto with steady liquidity is easier for the market to value fairly.
What is Crypto Liquidity?
Definition: Ease of buying and selling without significant price impact.
Measurement: Trading volume, order book depth, bid-ask spread.
High liquidity: Bitcoin and Ethereum, major tokens ($10B+ daily volume).
Low liquidity: Small-cap altcoins (less than $1M daily volume).
Liquidity Effects on Price
Thin order books: Small trades move price 10-30%.
Slippage: Actual execution price is worse than expected.
Manipulation: Whales can pump and dump illiquid tokens easily.
Example: Low-cap token with $100K volume sees a $10K sell order crash price by 50%.
Exchange Listings Drive Value
Tier 1 listings (Binance, Coinbase, Kraken): Gain 30-200% in days post-listing. Access to millions of users. Legitimacy signal.
Tier 2/3 listings: Smaller impact (5-30% pumps).
Delisting risk: Removal tanks price 50-90%.
Market Depth & Order Books
Bid-Ask Spread
Bitcoin: 0.01-0.05% (tight spread equals high liquidity).
Small altcoins: 1-5% (wide spread equals low liquidity).
Impact: Wide spreads increase trading costs.
Market Makers
Role: Provide continuous buy and sell quotes.
Effect: Smooth price discovery and reduce volatility.
Large tokens: Multiple market makers compete.
Small tokens: Often lack professional market making.
Volume Analysis
Real versus wash trading: Some exchanges fake volume.
CoinMarketCap and CoinGecko: Filter for real volume.
24H volume metric: Higher equals more liquid.
Stablecoin Dominance
$246.58B Daily Volume
97.71% of crypto volume: Most trades involve stablecoins.
Trading pairs: BTC/USDT and ETH/USDC are most liquid.
Impact: Stablecoins enable efficient price discovery.
Entry/exit: Traders move in and out of stablecoins, not fiat.
Stablecoin Types
Fiat-backed: USDT and USDC (most liquid).
Crypto-backed: DAI (decentralized but less liquid).
Algorithmic: Mostly failed (Terra/Luna cautionary tale).
Quantitative Valuation Models & Frameworks
Metcalfe’s Law Application
Theory: Network value is proportional to the square of users (V ∝ n²).
Formula: Value equals k times (Active Users)².
Bitcoin Application
Active addresses: Track daily and monthly active Bitcoin addresses.
Valuation: Correlate address growth with price.
Research findings: 94% correlation between n² and BTC market cap (historical studies).
Example: 1M active addresses might support $50K BTC. 2M addresses supports $200K (4x value from 2x users).
Limitations
Not all users are equal: Whales versus retail have different impacts.
Quality versus quantity: Active developers matter more than speculators.
Works better long-term: Short-term, speculation overwhelms network effects.
Network Value to Transactions (NVT) Ratio
Formula: NVT equals Market Cap divided by Daily Transaction Volume (USD).
Interpretation
Low NVT (less than 20): Network undervalued relative to transaction utility.
Fair value NVT (20-60): Reasonable valuation range for Bitcoin.
High NVT (greater than 80): Network overvalued. Potential bubble.
Similar to P/E ratio: Stock P/E equals Price divided by Earnings. Crypto NVT equals Market Cap divided by Transaction Value. Use: Identify overbought and oversold conditions.
Bitcoin NVT Historical Ranges
2015-2017 bull market: NVT spiked to 100+ at $20K peak (bubble indicator).
2018-2019 bear: NVT dropped to 30-40 (accumulation phase).
2021 peak: NVT reached 90+ at $69K (overvaluation signal).
2022 bottom: NVT fell to 35 at $16K (undervaluation).
Current (2025): NVT approximately 45-55 (fair value range at $105K).
NVT Signal (Improved Version)
Formula: Market Cap divided by 90-day MA of Transaction Volume.
Purpose: Smooths out volatility.
Thresholds: Above 2.0 is overvalued. Below 1.0 is undervalued.
Production Cost Models
Bitcoin Cost of Production
Current: $40,000-$45,000 per BTC (post-2024 halving).
Theory: Price gravitates toward production cost over time.
Support level: Prices rarely stay below production cost long-term.
Variable costs: Electricity, hardware depreciation, difficulty.
Hash Ribbons Indicator
30-day versus 60-day hash rate MA: When 30-day crosses above 60-day, it’s a buy signal.
Logic: Mining becomes profitable again. Capitulation is ending.
Historical accuracy: 80%+ accuracy identifying cycle bottoms.
Difficulty Ribbon
Compresses: Mining difficulty decreasing equals miner capitulation.
Expands: Mining difficulty increasing equals miner confidence.
Use: Difficulty compression at low prices equals potential bottom.
Stock-to-Flow (S2F) Model
Formula: S2F equals Total Supply (Stock) divided by Annual Production (Flow).
Bitcoin S2F Evolution
Pre-2012: S2F approximately 2 (similar to copper).
2012-2016: S2F approximately 10.
2016-2020: S2F approximately 25.
2020-2024: S2F approximately 50 (similar to gold).
Post-2024: S2F approximately 100 (twice as scarce as gold).
Model Predictions
Hypothesis: Higher S2F leads to higher price.
Controversial: Model predicted $100K+ by 2022. Bitcoin reached $69K then crashed.
Criticism: Oversimplifies. Doesn’t account for demand side.
Usefulness: Good for understanding scarcity, not precise price predictions.
Case Studies – Real-World Valuation Lessons
Case Study #1: Terra/Luna Collapse (May 2022) – $45B Destroyed
Background
The Terra ecosystem was built around a big promise: a stablecoin called UST that would always be worth one dollar without being backed by real dollars.
Instead of cash reserves, the system relied on a link between UST and another token, LUNA. The idea was simple on paper.
If UST went above one dollar, people could burn LUNA to create more UST and sell it for a profit. If UST dropped below one dollar, they could burn UST to get LUNA instead. Traders doing this for profit were supposed to keep the price stable.
What really pushed UST into the spotlight was Anchor Protocol. Anchor offered around 20 percent yearly returns on UST deposits, which was almost unheard of for something marketed as “stable.”
A huge amount of money flowed in because people saw UST as safe and Anchor as a reliable way to earn steady yield.
Over time, this made Anchor the main reason people were holding UST at all. The problem was that the whole system depended on confidence never breaking.
As long as people trusted the peg and kept money in Anchor, things looked fine. Once that trust cracked, the design had no real safety net to fall back on.
Flawed Tokenomics
Death spiral design: If UST de-pegs below $1, users swap 1 UST for $1 worth of LUNA. LUNA supply inflates to absorb UST. LUNA price crashes from dilution. Loss of confidence accelerates the de-peg.
Reflexivity: System relied on confidence. Once broken, it was irreparable.
Unsustainable yield: 20% APY was funded by VC capital, not real revenue.
The Collapse (May 7-13, 2022)
Trigger: Large UST sell pressure (LFG whale selling).
De-peg: UST fell to $0.98, then $0.90, then $0.60.
LUNA inflation: Supply exploded from 350M to 6.5 trillion tokens.
Price destruction: LUNA went from $120 to $0.0001 (99.999% loss).
Contagion: Crypto market lost $300B in days.
Impact on Value
$45B wiped out: LUNA plus UST market cap evaporated.
Investor lessons: Algorithmic stablecoins are high-risk. Unsustainable yields are ponzis. Tokenomics design matters more than hype. Reflexive systems can collapse overnight.
Long-term effect: Stablecoin scrutiny. GENIUS Act (2025) was partly a response to Terra. VC losses: Three Arrows Capital and Celsius went bankrupt due to Terra exposure. Market maturation: Industry learned hard lessons about stability mechanisms.
Read Also: Does Cryptocurrency Have Cash Value?
Case Study #2: Bitcoin Spot ETF Approval (January 2024) – Institutional Game-Changer
Pre-Approval Context
Before approval finally happened, a Bitcoin spot ETF felt like a door that just would not open. For over a decade, every application going back to 2013 was rejected by the U.S. Securities and Exchange Commission, usually with the same reasons around market manipulation and investor risk.
That stalemate started to crack after Grayscale Investments took the SEC to court and won, forcing regulators to rethink their position instead of dismissing applications outright.
As that legal win sank in, the market started pricing in the possibility that approval was no longer a long shot.
Throughout 2023, speculation alone pushed Bitcoin from roughly $25,000 to around $45,000, driven less by retail hype and more by the expectation that institutional money was finally about to get a regulated on ramp.
January 10, 2024 Approval
11 ETFs approved simultaneously: BlackRock (IBIT), Fidelity (FBTC), Grayscale (GBTC), and others.
First day: $4.6B trading volume.
Market reaction: Bitcoin gained 10% to $49,000.
Impact on Value Drivers
- Institutional access: Wealth managers, pension funds, and RIAs can now allocate.
- Liquidity: $25B+ inflows within 10 months.
- Legitimacy: SEC approval signals crypto maturation.
- Supply shock: ETFs must buy Bitcoin to back shares, removing supply from market.
- Price discovery: Efficient market pricing through regulated products.
Performance
BlackRock IBIT: $20B+ assets (fastest ETF launch in history).
Total ETF holdings: Approximately 950,000 BTC (approximately 5% of circulating supply).
Price impact: Bitcoin went from $45K (January 2024) to $126K (late 2024), a 180% gain.
Valuation Lesson
Regulatory clarity equals massive capital: Clear rules enable institutional billions.
Supply and demand: ETFs created continuous buy pressure on fixed supply.
Network effects: More institutional holders lead to more legitimacy, which leads to more adoption.
Case Study #3: 2024 Bitcoin Halving – Supply Reduction Reality Check
Pre-Halving (January-April 2024)
Before the 2024 halving, the mood in the market was pretty straightforward. Bitcoin’s supply was getting cut, so price had to go up.
That was the thinking everywhere. From January to April, people piled in ahead of the event and pushed price from about $45,000 to roughly $73,000, a 61 percent move driven mostly by expectations.
But while traders were focused on price, miners were dealing with a real problem. The halving meant their rewards were about to be slashed in half, which put serious pressure on smaller miners already operating on thin margins.
Some were wondering if they could even stay in business once the switch flipped. It was a reminder that the halving is not just a bullish headline, it is a stress test for the network.
April 19, 2024 Halving Event
Block reward: 6.25 BTC to 3.125 BTC.
Daily new supply: 900 BTC to 450 BTC (approximately $47M to approximately $24M worth).
Immediate impact: Price neutral (around $63,000).
Post-Halving Dynamics (April-December 2024)
- Mining costs doubled: $20K to $45K per BTC production cost.
- Hash rate dip: Down 5% as unprofitable miners shut off.
- Miner consolidation: Public mining companies gained market share.
- Difficulty adjustment: Approximately 2 weeks later, difficulty decreased, helping remaining miners.
- Price rally: Bitcoin rallied to $73K (May), then $88K (November), eventually $126K+ (late 2024).
Key Insights
Time lag: Major price impact takes 6-18 months post-halving.
Supply floor: Higher production costs provided support. Price stayed above $45K.
Demand matters: ETF inflows plus institutional adoption drove demand to absorb supply reduction.
Historical pattern holds: Each halving preceded a 12-18 month bull run (diminishing returns but still positive).
Valuation Lessons
Supply plus demand: Supply cuts matter only if demand is present.
Production costs: Mining economics provide a price floor in PoW coins.
Patience required: Halving effects unfold slowly, not overnight.
Fundamental plus catalyst: Halving narrative plus ETF approvals equals a powerful combination.
Practical Framework: How to Value a Cryptocurrency
Phase 1: Fundamental Analysis
1. Review Tokenomics (30 minutes)
- Total supply: Fixed, inflationary, or deflationary?
- Circulating supply: What percentage of total is available now?
- Allocation: Team and VC vesting schedules.
- Utility: What is the token actually used for?
- Burns: Any deflationary mechanisms?
- Emission: How many new tokens per year?
Red flags: Team holds over 40% of supply. No clear utility. Unlimited supply with no burns. Massive unlocks coming soon.
2. Assess Utility & Demand Drivers (20 minutes)
- Use cases: Does the token solve real problems?
- Adoption: Growing or shrinking user base?
- Competition: Do better alternatives exist?
- Network effects: Developer activity and partnerships.
- Revenue (if applicable): Does the protocol generate income?
3. Analyze On-Chain Metrics (15 minutes)
- Active addresses: Growing or declining?
- Transaction volume: Real usage or wash trading?
- NVT ratio: Current reading versus historical average.
- Exchange reserves: Decreasing equals supply shock potential.
- Whale concentration: What percentage do the top 10 holders control?
Phase 2: Technical Valuation
4. Calculate Market Cap Context (10 minutes)
- Current market cap: Price times circulating supply.
- Fully diluted valuation (FDV): Price times total supply.
- Rank: Where does it stand among the top 100?
- Compare to competitors: Fair value versus peers?
Example: Token A has $500M market cap, similar tech to Token B ($2B). Potential: If Token A reaches Token B’s valuation, that equals 4x return. Risk: Token B might be overvalued, or Token A deserves a discount.
5. Apply Valuation Models (20 minutes)
Metcalfe’s Law check: Are active users growing faster than price? (undervalued) Is price outpacing user growth? (overvalued)
NVT ratio: Calculate Market Cap divided by Daily Transaction Volume. Compare to historical range. Is it in overbought (greater than 80) or oversold (less than 30) territory?
Production cost (for PoW): Current mining cost per coin? Is price below cost? (potential bottom) Is price 3x+ above cost? (may correct)
Phase 3: External Factor Analysis
6. Regulatory & Risk Assessment (15 minutes)
- Legal status: Security, commodity, or unclear?
- Regulatory risk: SEC investigation? Countries banning?
- Tax treatment: How are holders taxed?
- Compliance: Do KYC/AML requirements hurt adoption?
7. Sentiment & Market Cycle (10 minutes)
- Fear & Greed Index: Current reading?
- Social media: Extreme hype or apathy?
- News flow: Recent positive or negative catalysts?
- Market phase: Bull, bear, or accumulation?
Phase 4: Comparative Valuation
8. Peer Comparison (15 minutes)
Compare market cap, daily active users, transaction volume, NVT ratio, and developer activity across similar projects.
Final Decision Framework
BUY Signals
- Strong fundamentals (utility, tokenomics, team)
- Growing adoption (users, transactions, developers)
- Low NVT ratio (less than 40) versus historical average
- Positive regulatory developments
- Fear & Greed below 30 (contrarian opportunity)
- Significantly undervalued versus peers
SELL/AVOID Signals
- Weak fundamentals (no utility, bad tokenomics)
- Declining adoption (users and transactions falling)
- High NVT ratio (greater than 80), bubble territory
- Regulatory crackdowns, SEC lawsuits
- Fear & Greed above 80 (euphoria)
- Significantly overvalued versus peers
Tools & Resources
- Price/market data: CoinGecko, CoinMarketCap, TradingView.
- On-chain metrics: Glassnode, CryptoQuant, Santiment.
- Tokenomics: Token Terminal, Messari, project whitepapers.
- Sentiment: Alternative.me Fear & Greed Index, LunarCrush.
- Developer activity: GitHub, Electric Capital Developer Report.
- Regulatory: SEC.gov, crypto policy trackers.
Conclusion
Understanding what determines cryptocurrency value transforms speculation into informed investing. Unlike traditional assets backed by earnings or government decree, crypto value emerges from the interplay of eight fundamental factors: supply scarcity, demand drivers, network effects, production costs, regulation, market sentiment, technology, and liquidity.
Bitcoin’s $2 trillion market cap isn’t random it reflects programmed scarcity (21M cap), $40K-$45K production costs, institutional adoption ($25B+ ETF inflows), and unmatched network security.
Ethereum’s $470B valuation stems from real utility powering $150B DeFi ecosystem and 200,000+ developers building applications. Meanwhile, thousands of failed tokens prove that hype without fundamentals leads to zero.
The 2024-2025 period showcased valuation principles in action: Bitcoin’s halving reduced supply 50%, spot ETF approvals unlocked institutional demand, and favorable regulatory shifts (GENIUS Act, SEC Task Force) removed risk premiums combining to drive Bitcoin from $45K to $126K. Conversely, Terra/Luna’s $45B collapse demonstrated how flawed tokenomics destroy value overnight regardless of hype.
Successful crypto investors apply frameworks: checking tokenomics for red flags, calculating NVT ratios to identify bubbles, tracking on-chain metrics to gauge real usage, and using Fear & Greed Index for contrarian timing.
They understand that supply scarcity matters only when demand exists, that regulatory clarity unlocks institutional billions, and that network effects create winner-take-most dynamics making Bitcoin and Ethereum difficult to disrupt.
Frequently Asked Questions
What determines the value of a cryptocurrency?
Cryptocurrency value is determined by eight primary factors: (1) supply scarcity through fixed caps or burns, (2) demand from utility and adoption, (3) network effects as more users join, (4) production costs like mining expenses, (5) regulatory environment and legal clarity, (6) market sentiment and speculation, (7) technological superiority and security, and (8) tokenomics including distribution and incentives.
Why does Bitcoin have value if it’s not backed by anything?
Bitcoin has value for the same reason gold does: scarcity, durability, fungibility, and widespread acceptance. Its fixed 21 million coin cap creates digital scarcity enforced by code.
Unlike fiat currency that governments can print infinitely, Bitcoin’s supply schedule is predictable and immutable. Value comes from: (1) $2T market cap showing millions believe it’s valuable, (2) ~$40K-$45K production cost providing price floor, (3) institutional adoption (ETFs, corporate treasuries), (4) network security from massive hash rate, and (5) utility as censorship-resistant money and inflation hedge.
Bitcoin doesn’t need government backing because its value is secured by math and global consensus.
How does supply and demand affect cryptocurrency prices?
Like any asset, crypto prices rise when demand exceeds supply and fall when supply exceeds demand.
Unique crypto factors: (1) Many cryptocurrencies have fixed supplies (Bitcoin’s 21M), so demand increases can’t be met with new supply, driving prices up sharply. (2) Supply shocks like Bitcoin halving cut new supply 50%, typically causing price rallies 6-18 months later. (3) Token unlocks release large amounts of locked supply, often crashing prices 20-50%. (4) Demand fluctuates based on utility (DeFi usage), speculation (FOMO), institutions (ETF inflows), and sentiment (Fear & Greed).
Price discovery happens 24/7 on global exchanges, making crypto more volatile than traditional assets.
What is tokenomics and why does it matter?
Tokenomics (token plus economics) describes a cryptocurrency’s economic model: supply schedule, distribution, utility, and incentives. It matters because good tokenomics enables sustainable growth while bad tokenomics causes failure.
Key elements: total supply (fixed versus unlimited), allocation (team versus community percentage), vesting (lock-up periods), utility (what the token is used for), burns (supply destruction), and staking rewards.
Example: Terra/Luna’s flawed tokenomics caused a $45B death spiral in May 2022. Well-designed tokenomics (Bitcoin’s 21M cap, Ethereum’s EIP-1559 burns) support long-term value. Always research tokenomics before investing.
How do Bitcoin halvings affect cryptocurrency value?
Bitcoin halvings occur every 210,000 blocks (approximately 4 years), cutting mining rewards in half. The April 2024 halving reduced rewards from 6.25 to 3.125 BTC per block, slashing daily new supply from 900 to 450 BTC.
Effects: (1) Supply scarcity increases dramatically. (2) Mining costs double ($20K to $45K per BTC), setting a higher price floor. (3) Historically, Bitcoin appreciates 300-9,000% in 12-18 months post-halving (diminishing returns each cycle). (4) 2024 post-halving: BTC rallied from $63K to $126K.
Halvings matter because fixed demand meeting reduced supply creates upward price pressure. However, demand still matters halving alone doesn’t guarantee appreciation.
Can cryptocurrency value go to zero?
Yes, individual cryptocurrencies can and do go to zero. Thousands of tokens have failed due to: (1) scams/rug pulls, (2) zero utility, (3) better competitors, (4) regulatory shutdowns, or (5) flawed economics (Terra/Luna).
However, major cryptocurrencies with strong fundamentals (Bitcoin, Ethereum) are unlikely to reach zero because: (1) massive network effects make them entrenched, (2) institutional holders won’t let investments fail, (3) real utility and adoption exist, (4) decentralization prevents single points of failure.
Rule: diversify. Small-cap altcoins carry high failure risk, while large-cap cryptos with proven use cases have survival probability.
How do regulations impact cryptocurrency value?
Regulations dramatically impact crypto value through legitimacy and access. Positive regulations (spot ETF approvals, GENIUS Act stablecoin framework, clear legal status) enable institutional participation, driving billions in capital inflows and 50-200% price increases.
Negative regulations (China mining ban, SEC enforcement actions) create uncertainty, reduce demand, and crash prices 30-70%. The 2025 U.S. regulatory shift SEC Chairman Paul Atkins, Crypto Task Force, Trump Executive Order triggered $400B+ market cap increase by signaling a pro-innovation approach.
Regulatory clarity reduces risk premium. Investors pay more when legal uncertainty is removed. Tax treatment also matters: Germany’s 0% tax (over 1 year hold) versus U.S. 39.6% affects investor behavior significantly.
What is the difference between market cap and price?
Price is the cost of one token. Market cap is total value (price times circulating supply). Market cap matters more for comparing cryptocurrencies.
Example: Token A costs $100 with 1 million supply equals $100M market cap. Token B costs $1 with 1 billion supply equals $1B market cap. Token B is 10x more valuable despite lower price.
Beginners fall for “cheap” coins (less than $1) not realizing supply matters. Bitcoin’s $105K price seems expensive versus Dogecoin’s $0.08, but Bitcoin’s $2T market cap versus Dogecoin’s $11B shows Bitcoin is 180x more valuable.
How can I evaluate if a cryptocurrency is overvalued or undervalued?
Use multiple metrics:
(1) NVT Ratio (Market Cap divided by Transaction Volume) above 80 is overvalued, below 40 is undervalued for Bitcoin. (2) Compare to competitors similar projects with 5x higher market caps might indicate undervaluation. (3) Fear & Greed Index extreme greed (greater than 80) suggests overvaluation, extreme fear (less than 20) suggests undervaluation. (4) On-chain metrics are active users and transactions growing faster than price? (5) Production costs is price far above mining costs? (6) Tokenomics does fully diluted valuation make sense?
Combine quantitative models with fundamental analysis. No single metric is perfect. Use multiple indicators for conviction.
Why are cryptocurrencies so volatile?
Crypto volatility stems from: (1) 24/7 global trading with no circuit breakers unlike stocks, (2) relatively small market ($3.47T versus $50T+ stocks) makes large trades move prices significantly, (3) high speculation many traders, few long-term holders create rapid sentiment swings, (4) leverage up to 100x leveraged trading amplifies moves, (5) news sensitivity tweets, regulations, and hacks cause instant 10-30% swings, (6) thin liquidity in smaller tokens allows manipulation, (7) lack of fundamental anchors like company earnings creates uncertainty.
Volatility decreases as markets mature: Bitcoin’s volatility halved from 2017 to 2025 but remains 3-5x higher than stocks.